A Developer’s Guide to LandGate's National Environmental Report Data
- Craig Kaiser

- Jun 9
- 7 min read

Environmental risk is one of the most common sources of project delay in energy and data center development. Federally protected species, wetlands, contaminated land, and soil conditions can each add months or years to a permitting timeline, and identifying them late in the process is expensive. LandGate's Environmental Report consolidates these risk factors into a single, structured document that developers can use to screen sites and prioritize further investigation before committing to full feasibility work.
This post walks through each section of a LandGate Environmental Report, explaining what data is provided and why it matters at each stage of a development decision.
Instantly Access Nationwide Property Data via LLM
LandGate’s comprehensive parcel asset data is available nationwide and fully optimized for AI. Using our Model Context Protocol (MCP) Server, you can pipe this granular site-selection data directly into your LLMs (like ChatGPT, Claude, or internal tools) to automatically generate custom reports, programmatically build developer dashboards, and analyze thousands of parcels in seconds.
Starting Point: The Summary and Risk Dashboard
The summary page organizes the report's findings into a clear risk framework. Each major environmental category receives a rating of High, Moderate, or Low, giving developers an immediate read on where a site's challenges are concentrated. The categories assessed are:
Federally Protected Species
Waters and Floodlands
Protected Lands
Contamination
Building Suitability

This risk dashboard is the screening layer. A site with multiple High ratings warrants a very different level of scrutiny than one with predominantly Low ratings, and the summary makes that comparison possible across a portfolio of candidate sites without requiring a detailed read of every section.
The summary also includes acreage details for key constraints (flood zones, wetlands, tree canopy, transmission line buffers, and steep topography) alongside the nearest substation and transmission line, replicating the grid infrastructure context from the Property Report so developers have a complete picture in one place.
Endangered Species: Regional Biodiversity Context
The endangered species section provides a heat map of biodiversity importance across the region surrounding the site. The map scores areas on a scale based on the diversity of species that are endangered or at risk of becoming endangered, with higher values indicating greater concentration of at-risk species.

This section is contextual rather than determinative. A high score on the regional map does not automatically mean development will be blocked, but it does signal that the site sits in an ecologically sensitive area where species surveys are more likely to be required. For developers comparing multiple sites, this map adds a useful differentiating signal before any site-specific work is commissioned.
Federally Protected Species: The Highest-Stakes Section
This section carries the most direct regulatory consequence of any in the report. It identifies threatened and endangered species whose habitat may overlap with the project boundary, organized by taxonomic class and including both common and scientific names along with each species' federal status under the Endangered Species Act.

The distinction between species found within the project boundary and species found nearby is important. Species identified within the project area present a higher likelihood of triggering permitting requirements or project modifications. Species identified nearby are less likely to require action but still warrant monitoring as design progresses.
For energy developers, bat species are a particularly common finding in many regions of the United States. Several bat species listed under the Endangered Species Act have broad habitat ranges that overlap with agricultural and forested land commonly targeted for solar development. A High rating in this category does not mean a project cannot proceed, but it does mean that a full habitat assessment or species survey conducted by a qualified biologist should be built into the project schedule early. Waiting until permitting to commission that work is one of the most avoidable sources of delay in energy development.
Waters and Floodlands: Wetlands, Flood Zones, and Waterway Buffers
The waters and floodlands section maps and quantifies two distinct types of water-related risk: flood exposure and wetland coverage.

Flood Zone Exposure
The report identifies acreage within the 100-year flood zone. For energy infrastructure, flood zone designation affects both permitting requirements and long-term asset risk. Ground-mount solar installations, substation equipment, and data center facilities all carry different tolerance thresholds for flood exposure, and acreage within a flood zone may need to be excluded from buildable area calculations or designed to elevated standards.
Wetland Types and Acreage
LandGate identifies wetlands by type, including freshwater emergent wetlands, freshwater forested and shrub wetlands, freshwater ponds, and riverine areas, each with associated acreage. This distinction matters because different wetland types carry different regulatory implications under Section 404 of the Clean Water Act and corresponding state programs.
The key practical guidance from this section is that even a small wetland presence does not necessarily stop development. As long as project activities are designed to avoid direct impacts to wetlands and waterways, federal and state permitting is generally not required. The more useful output from this section is knowing where the wetlands are and how much acreage they represent, so that site layout can be planned around them from the outset. A consultation with a wetland biologist to formally delineate the boundaries is typically the appropriate next step when wetland acreage is identified.
Protected Lands: Government Ownership and Land Restrictions
This section identifies whether any portion of the project area falls within government-owned or otherwise protected land, including federal, state, and locally protected designations.

For energy developers, this is largely a binary check. Land with a protected designation is generally unavailable for private development or carries restrictions that make traditional project structures unworkable. A Low rating in this category confirms that the site is free of those encumbrances and that land control can be pursued through standard acquisition or lease structures. A High or Moderate rating requires deeper investigation into the specific type of protection and whether any development pathways remain available.
Industrial Contamination: Superfund Sites and Underground Storage Tanks
The contamination section addresses two categories of environmental liability that can affect development feasibility and financing: nearby EPA Superfund sites and underground storage tank facilities.
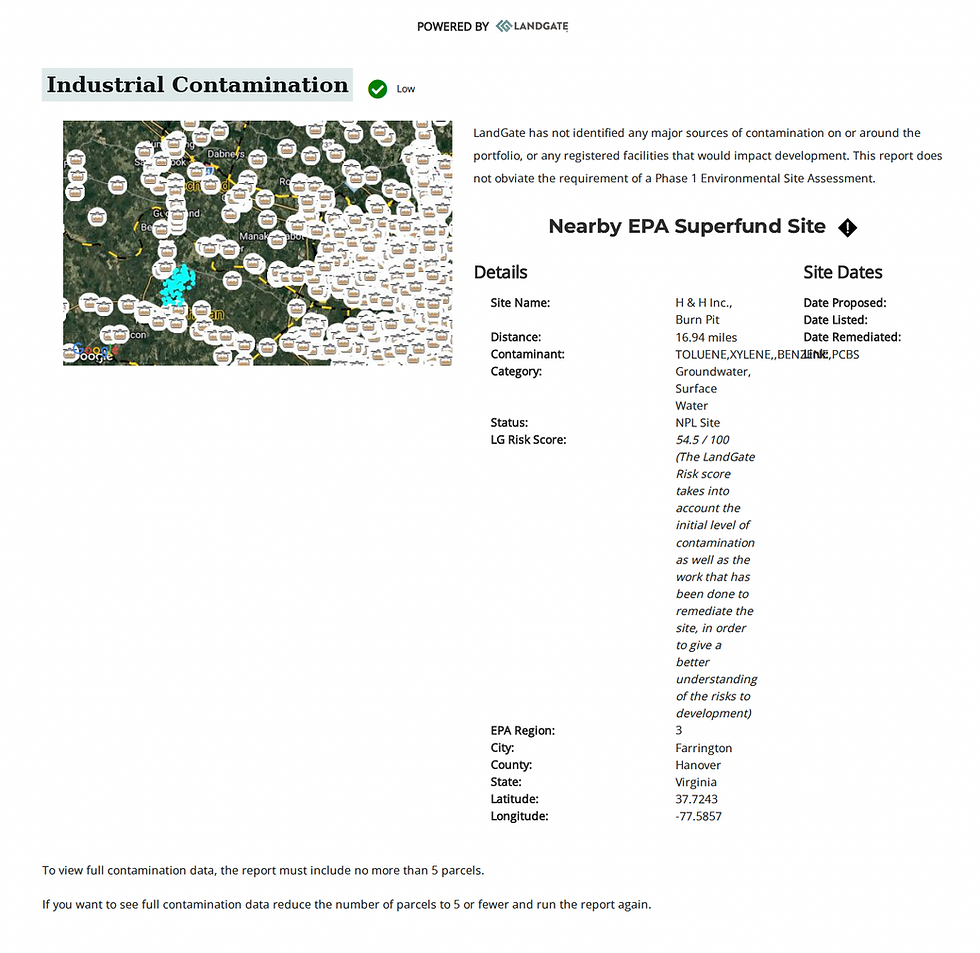
Superfund Sites
For any Superfund sites identified within a defined radius of the project, the report provides the site name, distance, contaminants of concern, affected media (soils, surface water, groundwater), current remediation status, and LandGate's proprietary risk score. That risk score is meaningful because it accounts not only for the initial contamination levels but also for the remediation work that has been completed, giving a more accurate picture of residual risk than status alone.
Distance and remediation status together determine how seriously a nearby Superfund site should be weighted. A fully remediated site several miles away presents a very different risk profile than an active site with groundwater contamination immediately upgradient of the project.
Underground Storage Tanks
The report identifies the nearest registered underground storage tank facility, including the substances stored, tank status (open, closed, or out of service), capacity, installation dates, and distance from the project boundary. Active tanks storing petroleum products near a project site can be a flag for soil or groundwater contamination that would not appear in a desktop screening but would surface in a Phase I Environmental Site Assessment.
It is worth noting explicitly that the contamination section of the Environmental Report does not replace the requirement for a Phase I ESA. Its value is in surfacing known registered risks early so developers can factor them into site selection and budget appropriately for additional investigation.
Building Suitability: Soil Conditions and Depth to Bedrock
This section is particularly relevant for data center developers and for solar projects with significant civil work requirements. It assesses soil conditions across the project area using two primary outputs: a soil suitability score and a depth-to-bedrock map.

Soil Suitability
Each soil type present on the site is scored and classified across several dimensions: soil quality class, suitability score, hydric group, drainage class, water table depth, slope gradient, and depth to bedrock. The suitability score is visualized on a color-coded map ranging from poor (0 to 20) to excellent (above 80), allowing developers to see at a glance which portions of the site present the greatest civil challenges.
Drainage class is a particularly important variable for both solar and data center development. Poorly drained soils increase grading and foundation costs, may require engineered drainage solutions, and can complicate construction scheduling. The water table depth field gives an early indication of whether dewatering may be required during construction.
Depth to Bedrock
The depth-to-bedrock map identifies areas where rock is at or near the surface. For solar projects, shallow bedrock affects pile-driving feasibility and may require the use of ballasted racking systems or rock anchors, both of which increase installed cost. For data center development, where significant subsurface work is typical, bedrock depth is a direct input into foundation design and cost estimation.

What This Report Tells You and What It Doesn't
A LandGate Environmental Report is a desktop screening tool built from remote sensing data, federal databases, and geospatial analysis. It is designed to identify known risks and flag areas requiring further investigation, not to replace the site-specific studies that follow.
Report Section | Decision It Supports |
Risk Dashboard | Portfolio-level site comparison and prioritization |
Endangered Species Heat Map | Regional sensitivity screening; survey planning |
Federally Protected Species | ESA compliance planning; biologist engagement timing |
Waters and Floodlands | Site layout planning; wetland delineation scoping |
Protected Lands | Land control feasibility; acquisition structure |
Contamination | Phase I ESA prioritization; financing risk assessment |
Building Suitability | Civil cost estimation; foundation and drainage planning |
What comes after a positive screening is site-specific: habitat assessments, wetland delineations, Phase I ESAs, and geotechnical investigations. The Environmental Report tells you which of those studies to prioritize and where on the site to focus them.
Access LandGate Environmental Report Data Your Way
Environmental due diligence is not optional in energy and data center development, but the sequence in which it is conducted matters enormously for schedule and budget. Commissioning a full suite of site studies on every candidate parcel before screening for environmental risk is an expensive way to find out a site was never viable. LandGate's Environmental Report inverts that sequence, putting the risk picture in front of developers at the earliest stage so that time and capital are directed toward sites with the highest probability of successful permitting.
Integrate with your enterprise LLM of choice: Unleash infinite possibilities by pulling our nationwide property data straight into your LLMs via the LandGate MCP Server. Programmatically generate custom developer dashboards, automate portfolio-wide risk screening, and build tailored internal reports instantly.
See it in action first: Want to view a complete, ready-to-use breakdown before connecting your systems?
Talk to our team: Ready to scale your land screening operations nationwide? Schedule a personalized walkthrough with our dedicated energy & infrastructure experts.
LandGate environmental reports provide an initial overview of potential project challenges and should not be used as a substitute for certified environmental assessments or Phase I Environmental Site Assessments. The exact conditions present or permits required for a project may differ from LandGate's evaluations.