A Developer's Guide to LandGate's Nationwide Battery Storage Due Diligence Data
- Craig Kaiser

- Jun 19
- 9 min read
For battery storage developers, investors, and asset managers, the questions that decide a project are different from those that decide a solar farm. A battery does not generate energy; it earns by moving energy through time, charging when prices are low and discharging when they are high, and by providing capacity and grid services. That makes storage economics a function of two things above all: whether the site can actually connect to the grid, and whether the local market offers a wide enough price spread to arbitrage. Those questions, alongside the permitting and siting risks that can stall a project, sit at the heart of LandGate's Battery Storage Due Diligence Report.
This post walks through each section of a Battery Storage Due Diligence Report, explaining what data is provided and why it matters for anyone evaluating whether a storage site is worth pursuing. The figures cited throughout come from the attached sample report, a 0.574 acre candidate site named Project 60 in Orange County, California, screened against the CAISO market and benchmarked to a CAISO 2039 summer peak case study. Where a solar economic report ends in a net asset value, a storage due diligence report is a siting and screening instrument: it tells a developer, quickly and across many dimensions, whether a parcel is a credible place to build a battery storage system.
Instantly Access Nationwide Storage Data via LLM
LandGate's battery storage data is available nationwide and fully optimized for AI. Using our Model Context Protocol (MCP) Server, you can pipe this granular siting, pricing, and interconnection data directly into your LLMs (like ChatGPT, Claude, or internal tools) to automatically screen candidate parcels, programmatically rank sites by arbitrage spread or offtake capacity, and stress test interconnection costs across thousands of locations in seconds.
Starting Point: The Score Card
The report opens with a score card that triages the site at a glance. It states the basic identity of the parcel (name, acreage, and location) and then grades the project across the risk dimensions most likely to make or break a storage development. In the sample, Project 60 is a 0.574 acre site in Orange County, California, carrying a high risk rating for federally protected species and contamination, and a low rating for both waters and floodlands and protected lands, with no acreage occupied by dwellings.

This score card matters because it lets a developer make a fast go, slow, or no-go decision before spending time on the detail. The small footprint is itself telling: batteries are energy-dense, so a fraction of an acre can host a meaningful project, which means siting hinges far more on grid access and risk than on land area. The two high flags, species and contamination, are exactly the kind of issues that drive permitting cost and timeline, and surfacing them on the first page tells the reader where the rest of the report deserves the closest reading.
Electrical Infrastructure
Because a battery's entire value depends on the grid, the report turns immediately to the electrical infrastructure around the site. It identifies the ISO or RTO, the nearest substation and its operating status, and the nearest transmission and distribution lines, then ranks the closest substations by the offtake capacity they can actually accept. For the sample, the site sits in CAISO, 0.1 miles from the in-service TRABUCO substation (138 kV), and just 0.01 miles from a San Diego Gas & Electric transmission line rated at 300 MW.

The offtake capacity table is the most important element here. It lists nearby substations with their proximity, maximum voltage, and available transfer capability (ATC) in megawatts: in the sample, CAPISTRANO at 3.4 miles offers 534.9 MW at 230 kV, TRABUCO at 0.1 miles offers 260.48 MW at 138 kV, and MARGARITA at 2.71 miles offers 187.87 MW. Proximity alone is not enough; a substation has to have room to accept the project's output. By pairing distance with available capacity, this section gives an immediate read on the single largest driver of interconnection feasibility and cost, which for storage is the first-order question of whether the project can exist at all.
Pricing: The Arbitrage Opportunity
For a battery, revenue is a pricing story, so the report dedicates a full section to the market signal at the project's specific settlement point. It anchors to a price node (TRABUCO_1_N009 in the sample) and compares prices at the trading hub against prices at the node, expressing the difference as a basis (delta) and ranking the location against both ISO and state percentiles across recent and forward periods.

This basis between hub and node is what a storage developer settles against, and the report makes its direction explicit. In the sample, the node priced above the hub over the trailing 60 months (a positive delta) but is forecast to price below it going forward (a negative delta of roughly 22 percent over the next 60 months), while still ranking in the mid-80s percentile within CAISO. The section also lists trailing time-series prices at the node (for example, $19.94/MWh over the last 365 days). Together these tell a developer not just how high prices are, but whether this particular location captures favorable pricing relative to the broader market, which is the difference between a node worth building at and one that quietly erodes margin.
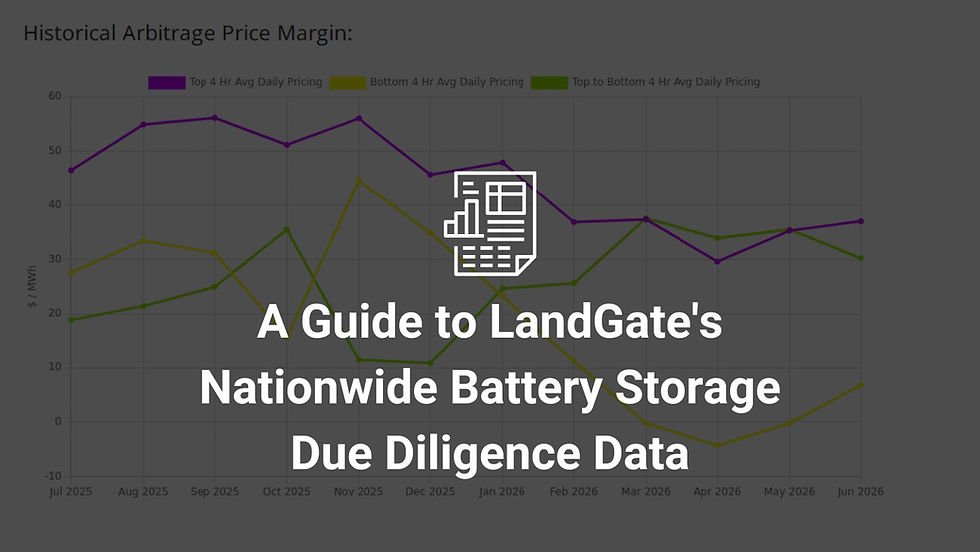
Historical Arbitrage Price Margin
Where the pricing section establishes the level of prices, this section quantifies the spread, which is what actually pays a battery. It charts the average daily price of the top four hours, the average daily price of the bottom four hours, and the difference between them, tracked month by month over the trailing year.

That top-to-bottom spread is, in effect, the daily arbitrage opportunity for a four-hour battery: the gap between what it pays to charge in the cheapest hours and what it earns to discharge in the most expensive ones. Plotting it over a year reveals both the typical margin and its seasonality, including periods where the spread compresses toward zero. For a developer modeling revenue, this is the cleanest single indicator of how much value the local market hands a storage asset on an average day, and how much that value swings across the seasons.
Network and Energy Resource Analysis
The report then moves from the headline grid picture into the detailed interconnection engineering. It models the cumulative cost of network upgrades required to inject into and take offtake from the chosen substation as a function of how much capacity the project seeks, and it identifies the specific limiting elements (the lines and transformers that constrain the flow) along with the upgrade cost each implies.

In the sample, the analysis runs against the TRABUCO 138 kV bus under Network Resource interconnection service. It lists a single injection limiting element (a Margarita-to-Trabuco line with a 574.1 MW transfer limit and roughly $1.5M in upgrade cost) and 20 offtake limiting elements, ranging from low-cost constraints that bind at modest capacity to multi-million-dollar transformer and line upgrades that only come into play at higher injection levels. The cumulative cost curve is what makes this actionable: it shows how interconnection cost escalates as a project pushes for more megawatts, letting a developer find the capacity sweet spot where the project maximizes size before triggering the next expensive upgrade. This is the granular, dollar-denominated version of the grid-access question the score card only flagged.
Interconnection Queues
No interconnection picture is complete without the competition, so the report lays out the projects already in line at and around the same substation. It separates the local generation queue at the chosen substation, the load interconnection queue nearby, and the broader regional generation queue, listing each project's capacity, point of interconnection, type, status, and in-service date.

This queue context matters because it signals both congestion and precedent. In the sample, the local queue at TRABUCO shows a 256.875 MW battery storage project (Captiva Energy Storage) still in queue alongside a withdrawn 304 MW battery, while the regional queue is dense with storage and legacy gas projects, many of them withdrawn. A high withdrawal rate and large queued capacity tell a developer how contested the local grid is, how much capacity may already be spoken for, and how realistic a new project's interconnection timeline is likely to be. The nearby load queue, populated here by manufacturing facilities, also hints at local demand that could shape future pricing and offtake.
State Incentives
The report summarizes the state-level tax incentives and programs that bear on storage economics in the project's jurisdiction. For the sample in California, it highlights the property-tax exclusion for solar-plus-storage systems under Revenue and Taxation Code section 73, the energy efficiency financing available to public-sector projects, and the state's energy storage procurement targets directed at investor-owned utilities through the CPUC.

These items matter because incentives and their deadlines can swing a project's economics and its schedule. The property-tax exclusion in the sample is time-bound, sunsetting on January 1, 2027, with systems required to be grid-connected by year-end 2026 to qualify, which turns a financial benefit into a hard timing constraint. Surfacing the relevant programs and their expiry dates lets a developer factor policy support, and policy risk, into the build decision rather than discovering it late.
Surrounding Infrastructure
Storage rarely sits in isolation, so the report profiles the energy and demand infrastructure around the site: the nearest solar farm, wind farm, data center, and data center power source, each with distance, status, and key operating details. In the sample, the nearest solar farm (Mission Viejo High, 2.45 miles, 0.955 MW) comes with PPA pricing data, the nearest data center (Lumen Irvine 1, 6.36 miles) is an active colocation facility with 6 MW of gross power, and a nearby proposed data center power source is a 330 MW natural-gas-backed project.


This surrounding context speaks directly to opportunity. A nearby solar farm signals potential for pairing or co-location and gives a real PPA price reference; in the sample the solar PPA is estimated at $131.21/MWh against an $84.33/MWh average, with a PPA-to-market ratio of 3.87. A nearby data center signals concentrated, growing electricity demand and a potential offtake counterparty, which is increasingly central to storage value as load growth reshapes these markets. By mapping what surrounds the site, the report helps a developer spot pairing, offtake, and revenue-stacking options that a grid-only view would miss.
Environmental Aspects
The report closes with the environmental and permitting risk that the score card first flagged. It presents a regional endangered-species diversity heatmap, then details the federally protected species that may be present in or near the project boundary, organized by class, with each species' family, common and scientific name, and federal status, plus a plain-language note on how much development risk each class poses.

For the sample, the federally protected species risk is rated high, with listed species spanning amphibians (the endangered arroyo toad), birds (including the endangered least Bell's vireo and the threatened coastal California gnatcatcher), fish and aquatic invertebrates, plants, and reptiles. The report is careful to distinguish species that pose real development risk from those whose risk is minimal absent impacts to waterways or wetlands, and it notes that a qualified biologist's habitat assessment remains the definitive step. This early read matters because protected species are one of the most common causes of permitting delay and added mitigation cost, and knowing which species and which habitats are in play lets a developer scope environmental diligence and timeline realistically from the outset.
What This Report Tells You and What It Doesn't
A LandGate Battery Storage Due Diligence Report is a siting and screening tool. It combines grid, market, interconnection, incentive, infrastructure, and environmental data into a single picture that is directionally accurate and immediately useful for deciding whether a candidate site deserves deeper investment. It is not a substitute for the formal interconnection study, Phase I environmental site assessment and habitat survey, detailed revenue model, and confirmed offtake terms that a project requires to move toward construction. The high contamination flag in the sample, for instance, points to a Phase I assessment as a necessary next step rather than a conclusion the report itself can reach.
Report Section | Decision It Supports |
Score Card | Rapid go, slow, or no-go triage across top risk dimensions |
Electrical Infrastructure | Confirming grid access and available offtake capacity |
Pricing | Assessing locational price level and hub-to-node basis |
Historical Arbitrage Price Margin | Sizing the daily charge-and-discharge spread |
Network and Energy Resource Analysis | Estimating interconnection and network-upgrade cost by capacity |
Interconnection Queues | Gauging queue competition and congestion risk |
State Incentives | Identifying policy support and qualifying deadlines |
Surrounding Infrastructure | Spotting co-location, offtake, and pairing opportunities |
Environmental Aspects | Flagging species and permitting risk early |
What comes after a strong screening is detailed interconnection study, environmental survey, and negotiated offtake. The report's value is in giving developers and investors enough information to decide quickly whether a site's grid access, arbitrage opportunity, and risk profile justify that deeper commitment of time and capital, and to enter those later stages with a clear-eyed view of where the obstacles lie.
Access Battery Storage Due Diligence Data
The gap between a parcel that looks like a battery site and one that actually becomes a project is almost always a matter of grid access, market spread, and permitting risk, factors that interact in ways that are difficult to judge by intuition. LandGate's Battery Storage Due Diligence Report brings that full picture forward to the screening stage, giving developers and investors a data-driven read on interconnection, arbitrage, incentives, and environmental risk before significant capital is committed. For anyone evaluating multiple candidate sites, it turns storage viability into a screening criterion rather than a late-stage discovery.
Integrate with your enterprise LLM of choice: Unleash infinite possibilities by pulling our nationwide property, grid, and market data straight into your LLMs via the LandGate MCP Server. Programmatically screen storage parcels, automate site ranking by arbitrage and offtake capacity, and build tailored internal dashboards instantly.
See it in action first: Want to view a complete, ready-to-use breakdown before connecting your systems?
Talk to our team: Ready to scale your storage screening operations nationwide? Schedule a personalized walkthrough with our dedicated energy and infrastructure experts.
LandGate Battery Storage Due Diligence Reports are based on site parameters, grid and market data, modeled interconnection costs, and publicly available environmental and incentive information. Results are directional estimates intended for screening and siting purposes and should not be used as a substitute for a project's formal interconnection study, environmental site assessment and habitat survey, detailed revenue model, or confirmed offtake and financing terms. Actual grid access, interconnection cost, market pricing, permitting requirements, and project value may differ from report findings.


