The Power-to-Fiber Ratio: Connectivity is the New Interconnection Queue
- Ishan Bhattarai

- May 19
- 3 min read
For the past two years, data center site selection has been almost entirely driven by one variable: substation proximity. Developers have pushed into secondary and tertiary markets they would have passed over five years ago simply to secure MW commitments ahead of their competitors.
That calculus is now insufficient. The shift toward generative AI workloads has exposed a second constraint that power-first site selection often overlooks: fiber. A site with 100 MW of available capacity but no high-throughput connectivity path is operationally limited regardless of its power economics.
The developers moving fastest in this environment are underwriting both variables simultaneously. They are evaluating sites based on their Power-to-Fiber Ratio, or the relationship between available MW capacity and the cost, distance, and timeline to achieve high-capacity fiber connectivity.
The Hidden Cost of the Fiber Desert
AI inference workloads have different latency tolerances than traditional cloud storage. GPU clusters running distributed training require high-bandwidth, low-latency fabric between nodes; inference serving requires fast egress to end users. Both place real constraints on acceptable fiber distance. Unlike interconnection queue position which is at least a known variable at the time of site selection, fiber gap costs tend to surface later in diligence, when they are harder to reprice into the deal.
Consider a 50-acre parcel with immediate substation access that sits 15 miles from the nearest long-haul fiber Point of Presence (PoP). Before the first server rack is installed, the project faces a material connectivity cost that was not in the original underwriting.
Trenching cost: Depending on terrain and Right-of-Way (ROW) complexity, conduit installation runs $100,000–$250,000 per mile. A 15-mile gap translates to $1.5M–$3.75M in direct infrastructure spend before factoring in carrier lit service fees.
Permitting timeline: ROW acquisition across rail corridors, private parcels, or jurisdictions with environmental review can take 12–24 months. In many cases this timeline exceeds the power interconnection queue—meaning fiber, not power, becomes the schedule constraint.
A site acquired at a land cost discount can quickly give back that spread and more once middle-mile connectivity costs are modeled into the project budget.
The Three Tiers of Infrastructure Site Selection
LandGate’s integrated infrastructure layers allow sites to be categorized across three tiers based on their combined power and fiber profile:
Tier | Infrastructure Profile | Best Use Case |
Tier 1: The Golden Zone | Direct adjacency to a Substation (115kV+) AND a Long-Haul Fiber Backbone. | Hyperscale AI & Inference. These sites command the highest premiums and fastest exits. |
Tier 2: The Build-Out | Strong Power capacity, but 2–5 miles from Fiber PoP. | Enterprise Data Centers. Requires a capital injection for "Middle Mile" fiber, but feasible with the right IRR. |
Tier 3: Power-Only | High Power capacity, but 10+ miles from Fiber. | Compute workloads with minimal egress requirements. Bitcoin mining, HPC batch processing, and archival storage are viable. AI inference and real-time serving are not. |
Mapping the Intersection with LandGate
The practical obstacle for most site selection teams is fragmentation: electrical infrastructure data lives in one tool, fiber carrier maps in another, and environmental constraint data in a third. Reconciling these sources manually is slow—and in a market where competitive LOIs move within days of a site going to market, slow analysis has a real cost.
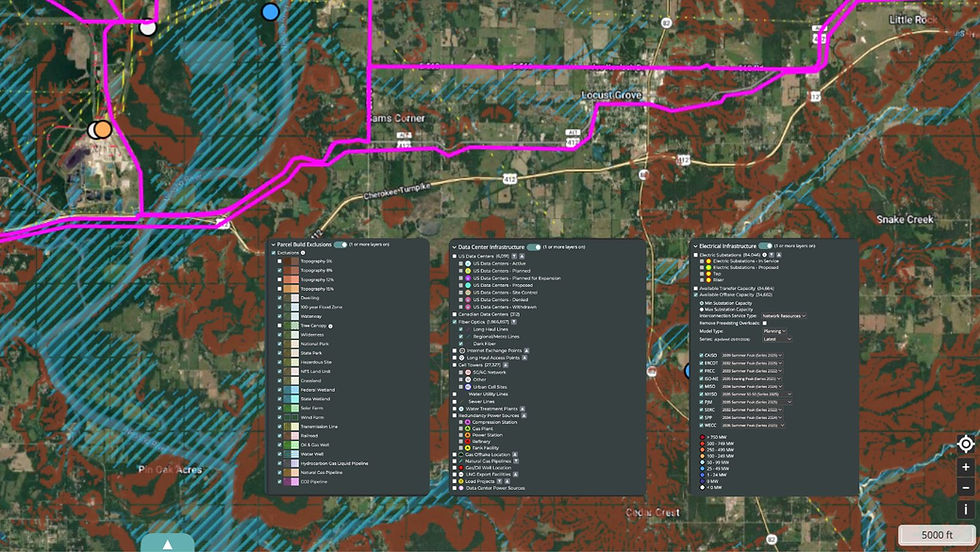
LandGate addresses this by consolidating the full infrastructure stack into a single platform:
Power layer: Substation locations, transmission line voltage ratings, and available capacity indicators; queryable at the parcel level.

Available Capacity by Substation on the LandGate Platform
Fiber layer: Long-haul and metro fiber routes overlaid with carrier ownership (Zayo, Lumen, and others), so developers can assess both physical proximity and negotiation counterparty in a single view.

Fiber Optics Infrastructure on the LandGate Platform
Constraint layer: Topographic and environmental data that flags ROW complexity before a team invests time in site visits or LOI drafting. A 2-mile fiber gap through a protected watershed is a fundamentally different risk than a 2-mile gap across open farmland.

Building Constraints & Parcel Exclusions on the LandGate Platform
Moving Ahead with the Power-to-Fiber Ratio
Site selection in 2026 is an infrastructure underwriting exercise. Power access remains necessary, but it is no longer sufficient on its own. The projects that close fastest and hold value through lease-up are the ones where power capacity and fiber proximity were evaluated together from day one, with construction cost and permitting risk quantified before the LOI was signed.
Is your current site evaluation process accounting for fiber gap cost and timeline? LandGate’s infrastructure platform lets you overlay power and fiber data nationally, so you can identify sites where both variables align. Book a demo with our dedicated energy infrastructure team to learn more.


