A Developer’s Guide to LandGate's Nationwide Offtake Capacity Data
- Craig Kaiser

- Jun 11
- 6 min read

For energy and data center developers, finding a site with strong land characteristics and clean environmental conditions is only part of the equation. The other part is understanding whether the grid can actually absorb the power a project will generate, and at what cost. That question sits at the heart of LandGate's Offtake Report, which analyzes interconnection feasibility at a specific point of interconnection (POI) before a developer commits to the formal and expensive utility interconnection study process.
This article walks through each section of a LandGate Offtake Report, explaining what data is provided and why it matters for developers evaluating whether a site can support their target project capacity.
Instantly Access Nationwide Property Data via LLM
LandGate’s comprehensive offtake capacity data is available nationwide and fully optimized for AI. Using our Model Context Protocol (MCP) Server, you can pipe this granular site-selection data directly into your LLMs (like ChatGPT, Claude, or internal tools) to automatically generate custom reports, programmatically build developer dashboards, and analyze thousands of parcels in seconds.
Starting Point: Project Details
The report opens by establishing the parameters of the analysis: the substation being studied, the requested injection amount in megawatts, the utility owner, and the grid operator case study used as the modeling baseline.
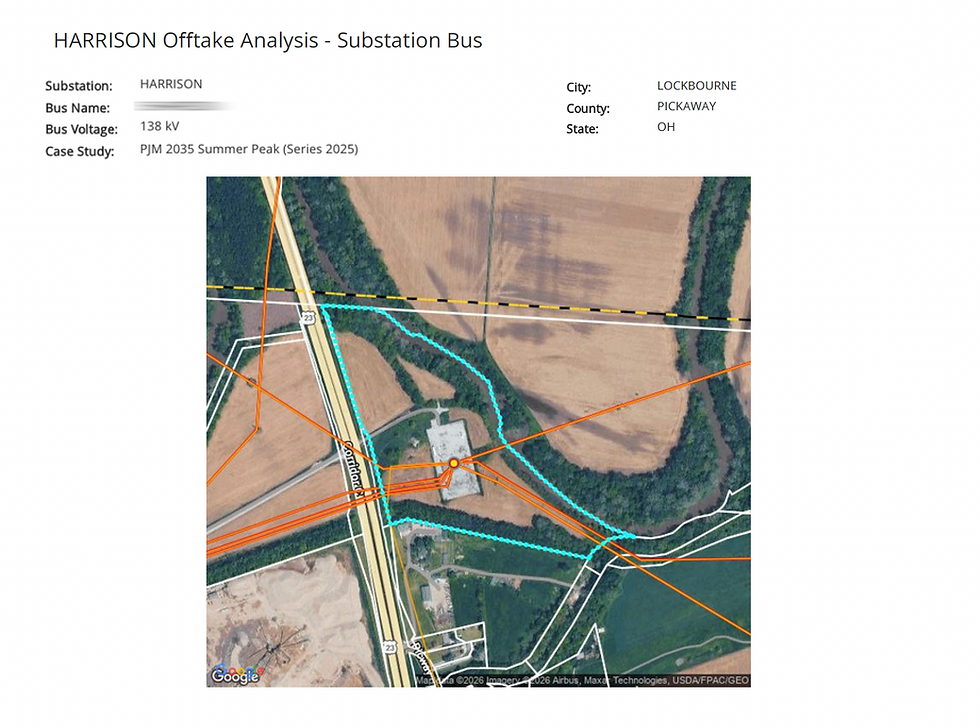
These inputs matter because interconnection feasibility is not a static property of a substation. It is a function of how much power is being injected, under what grid conditions, and against what baseline load scenario. A substation that can absorb 50 MW cleanly may require significant network upgrades to absorb 150 MW. By anchoring the analysis to a specific injection amount and a defined grid case, the report produces findings that are directly comparable to the developer's actual project parameters rather than theoretical maximums.
Offtake Analysis: Capacity, Limiting Elements, and Upgrade Costs
This is the analytical core of the report. It addresses the fundamental question every developer needs answered before advancing a site: how much power can this POI actually deliver to the grid, and what will it cost to get there?
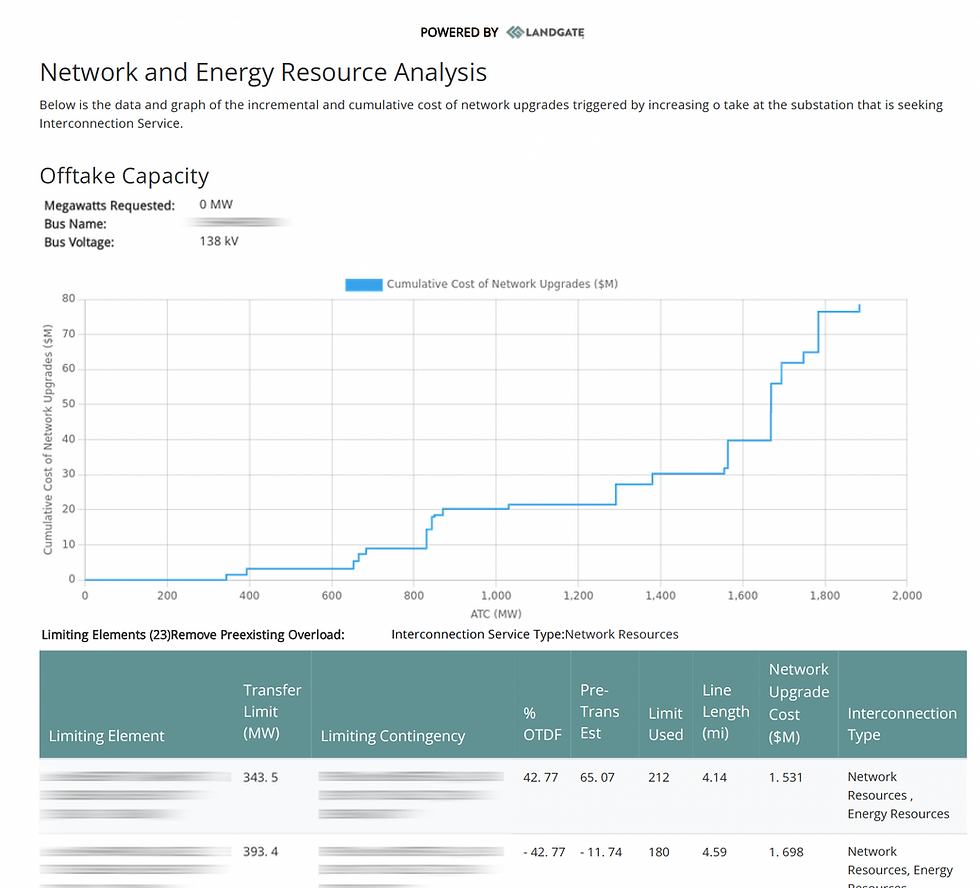
The Offtake Capacity Curve
The report presents an offtake capacity curve that plots cumulative network upgrade costs in millions of dollars against available transfer capacity in megawatts. This curve is one of the most useful outputs in the entire report because it visualizes the cost structure of interconnection at increasing capacity levels.
The shape of the curve tells a clear story. A flat section early in the curve indicates that initial megawatts can be injected with minimal upgrade cost. Step increases in the curve identify the capacity thresholds at which specific network constraints are hit, triggering upgrade requirements. A developer can read directly from the curve what their upgrade cost exposure looks like at their target capacity, and whether scaling the project up or down would materially change that cost.
For developers with flexibility on project size, this curve is a negotiating and optimization tool. It may reveal that a 100 MW project incurs substantially lower upgrade costs than a 150 MW project, or that a modest capacity reduction avoids a major constraint entirely.
Limiting Elements Table
The offtake analysis table identifies the specific transmission lines and network elements that constrain injection at the POI. For each limiting element, the report provides:
Transfer limit: The thermal or stability limit of the element in megawatts.
Percentage OTDF (Outage Transfer Distribution Factor): How sensitively the element responds to power injected at the POI. Higher values indicate greater exposure to the project's generation.
Pre-transmission estimate: The estimated power flow on the element before the new project injection is added.
Limit used: The effective capacity ceiling applied in the analysis.
Line length: The physical length of the constrained element, which is a proxy for the cost of any required upgrade.
Network upgrade cost: The estimated cost to relieve the constraint at the requested injection level.
Interconnection type: Whether the constraint requires resolution through network resources, energy resources, or a combination.
Together these columns explain not just how much capacity is available but which specific parts of the grid are creating the bottleneck and what resolving each one would cost. That level of specificity is difficult to obtain without a formal utility study, and it is what allows developers to make informed go/no-go decisions at the site screening stage rather than after months of interconnection queue participation.
Interconnection Queue: Who Is Ahead of You
The interconnection queue section is often underappreciated but carries significant practical importance. It lists all projects currently in the interconnection queue at substations in the relevant area, including each project's queue date, capacity, point of interconnection, generation or storage type, and current status.
This section answers a question that grid data alone cannot: how congested is the path to interconnection, and how long is the line?

Why Queue Position Matters
Interconnection studies are conducted in a defined sequence, and projects that enter the queue later bear the cost of network upgrades required by earlier projects as well as their own. A substation with a clean technical profile but a heavily loaded queue may present as much practical risk as one with more network constraints, simply because the upgrade costs allocated to late-queue entrants can be substantial and unpredictable.
The queue table gives developers the ability to assess this risk concretely. Key things to evaluate include the total capacity already queued at nearby substations, the proportion of projects still in early study stages versus those that have advanced to interconnection agreements, and the share of projects that have withdrawn. High withdrawal rates can actually be a positive signal, as they suggest that the queue is thinning and that capacity is opening up.
Generation and Storage Type Patterns
The type of projects in the queue also provides context. A queue dominated by battery storage projects at a particular substation may indicate that the area has limited hosting capacity for generation but is being targeted for grid support services. A mixed queue of solar and storage points to a more developed renewable energy ecosystem in the region, which can be a positive signal for permitting familiarity and offtake market depth.
What This Report Tells You and What It Doesn't
A LandGate Offtake Report is a pre-queue screening tool. It uses publicly available grid data and power flow modeling to produce a cost and capacity picture that is directionally accurate and practically useful for site selection. It is not a substitute for the formal interconnection study that a utility conducts once a project enters the queue.
Report Section | Decision It Supports |
Project Details | Confirming analysis parameters match project scope |
Offtake Capacity Curve | Upgrade cost estimation; project sizing optimization |
Limiting Elements Table | Identifying specific grid constraints and resolution costs |
Interconnection Queue | Assessing competitive queue position and timeline risk |
What comes after a positive Offtake Report screening is engagement with the utility and formal queue entry. The report's value is in giving developers enough information to decide whether that step is worth taking, and to enter the queue with a realistic understanding of what the interconnection study is likely to find.
Access Offtake Capacity Data
Interconnection is where many energy projects fail, and it is where the gap between a site that looks viable on paper and one that actually gets built is most often found. The formal utility interconnection study process is slow, costly, and sequential, and it reveals constraints that are difficult to anticipate without prior grid modeling. LandGate's Offtake Report brings that analysis forward to the site screening stage, giving developers a data-driven picture of grid capacity, upgrade costs, and queue competition before any queue fees are paid or study timelines are entered. For developers evaluating multiple candidate sites, the Offtake Report is the tool that makes grid feasibility a screening criterion rather than a late-stage discovery.
Integrate with your enterprise LLM of choice: Unleash infinite possibilities by pulling our nationwide offtake data straight into your LLMs via the LandGate MCP Server. Programmatically generate custom developer dashboards, automate portfolio-wide risk screening, and build tailored internal reports instantly.
See it in action first: Want to view a complete, ready-to-use breakdown before connecting your systems?
Talk to our team: Ready to scale your land screening operations nationwide? Schedule a personalized walkthrough with our dedicated energy & infrastructure experts.
LandGate Offtake Reports are based on publicly available grid data and power flow modeling. Results are directional estimates intended for site screening purposes and should not be used as a substitute for formal utility interconnection studies. Actual upgrade costs and available capacity may differ from report findings.