Hyperscale Data Center Tracking: A Competitive Analysis Playbook for Developers


Where the hyperscalers build next determines where land and power get expensive, which markets get crowded, where self-build displaces leasing, and where a colocation provider or developer can still win a deal. Hyperscale data center tracking, done well, tells you all of that before your competitors see it.
This post walks through a practical framework for tracking hyperscaler activity, what each data point tells you competitively, and how to turn that intelligence into site selection, pricing, and partnership decisions.
How to Track Hyperscale Data Center Development: The 5-Part Framework
Tracking hyperscale data center development looks at five categories of data. Each answers a different competitive question.
1. Map Global and Domestic Competitor Footprints
Gaining the first-mover advantage requires tracking competitor activities across both local markets and global expansion corridors. This helps you understand which markets are about to tighten, and which are being abandoned. Start by mapping global and domestic competitor development, including location and project status. Active facilities show where a hyperscaler is today. Planned, proposed, and planned for expansion projects show where it's going. Denied and withdrawn projects are just as valuable, because they flag markets where permitting, community opposition, or power constraints stopped a well-funded buyer.
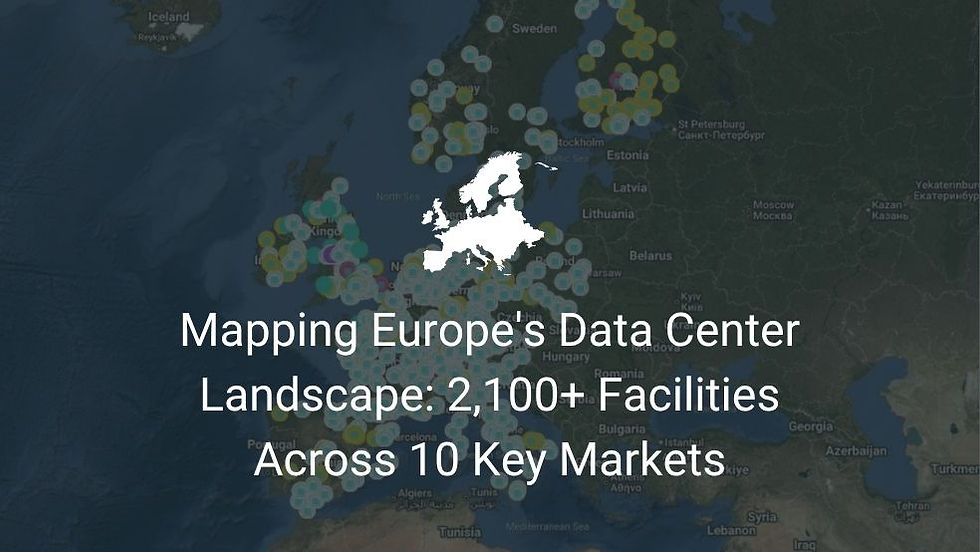
LandGate tracks over 6,300 domestic facilities in the U.S. and 4,000+ international facilities across 160+ countries by status, giving developers complete visibility into market density and expansion patterns. Users can also filter data centers by Operator Name to visualize these patterns for specific developers and use the Company Profiles within the Data Center Dashboard for benchmarking.

Additionally, look at pipeline clusters rather than individual announcements. A single campus is news. Three planned or expanding sites from the same company within one utility territory is a strategy, and it usually means land, power, and contractor pricing in that area are about to move. For a high-level instant analysis, use LandGate’s Data Center Dashboard to see a hyperscaler’s distribution by state.

2. Data Center Build Specifications
The next step is to analyze the hyperscaler’s build specs. Gross power, white space, rack counts, power capacity per rack, PUE, and chip and cooling specifications tell you what kind of capacity a hyperscaler is deploying in each location. A campus designed for high-density liquid-cooled AI training looks very different from a cloud availability zone built for general computing. This helps you determine what standard your facility needs to meet to compete for this tenant or to avoid competing with their campuses.

For a colocation provider, build specs reveal whether a nearby hyperscale campus is a threat (it's absorbing the workloads you'd target) or an opportunity (it's a training site that will need inference and interconnection capacity nearby). For a developer, rack density and cooling specs inform how you design a powered shell that a hyperscaler would actually lease.
3. Power Strategy Analysis
The third step is to analyze their power strategy, which shows you which power pathways are crowded and which are still open. Power is the binding constraint in nearly every major market, and the hyperscalers have moved aggressively to secure it outside the traditional utility queue. Recent examples span every technology: Microsoft's agreement to restart the Three Mile Island unit, Amazon's power agreement with Talen Energy at the Susquehanna nuclear plant, and Google's enhanced geothermal partnership with Fervo Energy.

If a hyperscaler has locked up the available behind-the-meter gas supply or the remaining hosting capacity on a substation, that pathway is effectively closed to you. Conversely, a hyperscaler's power strategy in one ISO often previews the structures it'll seek elsewhere, which is useful for developers designing projects to be acquisition-ready.
4. Project Economics, Financials and Leasing
Ownership structure, total and quarterly revenue, year-over-year growth, financing cash flows, and Uptime tier ratings show the financial engine behind each portfolio. Leasing data adds the market view: lease rates, vacancy rates, portfolio estimates, and lease lengths. This reveals where the pricing headroom is and how much negotiating power you may have.

This is where tracking turns directly into revenue. If vacancy is near zero and a hyperscaler is signing long-term leases in a submarket, you have pricing power. If its own self-build pipeline is about to deliver, that headroom may disappear. Project cost and downtime figures for comparable sites also give you a benchmark for your own development budget and reliability positioning.
5. Company Partnerships
Major partnerships with operators, developers, utilities, chip vendors, and power providers show which companies hyperscalers trust and how they prefer to structure deals. This reveals who your competitors are for that tenant and who could potentially be a partner.

If a hyperscaler repeatedly partners with a particular developer or colocator in a region, you're competing with that relationship, not just with other sites. Partnership patterns also point to joint venture or build-to-suit structures you can propose.
Turning Hyperscale Intelligence Into Competitive Moves
Data only matters if it changes decisions. Here's how developers and colocation providers are putting hyperscale tracking to work.
Site selection ahead of demand. Map hyperscaler pipeline clusters against available parcels, substations, fiber, and gas infrastructure. The goal is to identify land with a credible power pathway near emerging hyperscale clusters before parcel pricing reflects that demand. Markets adjacent to established hubs (outside Northern Virginia, Phoenix, or Dallas, for example) often offer the best combination of proximity and available power.
Pricing and positioning. Use lease rates, vacancy, and lease lengths in a submarket to set asking rents, and use hyperscaler build specs to decide whether to position your capacity as complementary (inference, edge, interconnection) or competitive (wholesale hyperscale).
Risk screening. Denied and withdrawn projects are early warnings. If a hyperscaler with deep pockets and experienced permitting teams couldn't get a project approved in a county, that's a signal worth weighing before you commit capital there.
Power pathway planning. Knowing which substations, pipelines, and generation assets hyperscalers have already tied up helps you avoid queues you can't win and find pathways (behind-the-meter gas, geothermal, co-located generation) that are still open.
Partnership targeting. Hyperscaler partnership patterns and portfolio distribution show where a build-to-suit, powered-land, or joint venture offer is most likely to land.
Tracking the hyperscalers is how you see the market's next move instead of its last one.
How LandGate's Data Center Dashboard Supports Hyperscale Tracking
Historically, assembling this picture meant stitching together earnings filings, broker reports, utility filings, local permitting records, and news coverage, then trying to map it all. LandGate's new Data Center Dashboard consolidates those signals into one view built for competitive analysis.
Company and financial profiling. Ownership, total revenue, quarterly financials, year-over-year revenue, financing cash flows, and Uptime tier ratings for data center operators.
Leasing information. Lease rates, vacancy rates, portfolio estimates, and lease lengths, the data most directly tied to pricing decisions.
Power infrastructure. ISO distribution, behind-the-meter connections and site specifications, and power contracts including PPAs, ESAs, and power-matching arrangements.
Hyperscale profiling. Build specifications, portfolio distribution, buildout and project completion tracking, chip and cooling specifications, and major company partnerships.
Exclusive site-level specs. Project cost and downtime for each site, giving developers and colocation providers benchmarks that are difficult to find anywhere else.
The dashboard sits on top of LandGate's broader data center intelligence: more than 6,300 domestic facilities and more than 4,000 international facilities across 160+ countries, with project statuses spanning active, planned, site control, proposed, planned for expansion, withdrawn, and denied. Because it lives on the same platform as LandGate's parcel data and infrastructure layers, including substations, offtake and ATC data, large load interconnection, fiber, gas pipelines and offtake, and water infrastructure, you can move directly from "where is this hyperscaler expanding?" to "which parcels nearby have a viable power pathway?"