
How to Find and Screen Community Solar Sites: A Step-by-Step Workflow

Community solar developers face a version of the same problem that trips up every energy developer: the cost of finding out a site doesn't work climbs steeply the longer you wait to find out. A parcel that fails on hosting capacity is cheap to rule out on a map. The same parcel is expensive to rule out after a signed lease option, a zoning application, and a formal interconnection request.
The developers who move fastest treat community solar site selection as a funnel, not a single decision. They start broad - where is the market even open - and narrow step by step, killing bad sites early and only spending real money on the ones that survive every filter. This guide walks through that full process, from market analysis to a final kill/advance decision, using the data layers and tools available in LandGate at each stage.
How to Find and Screen Community Solar Sites in LandGate
The 5-step process for finding and screening community solar sites with LandGate looks like this: sizing up the market and competition, filtering parcels by location and grid proximity, screening each site for physical and legal constraints, drilling into grid-level detail to catch fatal upgrade costs, and finally running the economics to make a clear go/no-go decision.
Step 1: Market & Competitive Analysis
Before evaluating individual land tracts, analyze regional markets to target favorable territories, understand incentive structures, and map high-level developer density.
Target Favorable Markets: Focus on states with active community solar frameworks, strong net-metering policies, or high Locational Marginal Pricing (LMP) signals.
Map Project Density: Is your target region already saturated with utility-scale or community solar projects competing for the same grid capacity? Use LandGate’s Solar data layer to evaluate regional market saturation, review existing solar farm density, and identify underserved white space where landowner options remain open.
Agrivoltaic Activity: Agrivoltaic projects are a useful proxy for markets where dual-use siting (solar plus continued agricultural use) is gaining traction, which is often a sign of more favorable local reception.
Local Solar Ordinances: Available in LandGate's Solar Data layer to flag jurisdictions with setback requirements, permitting restrictions, or outright moratoriums that could stall or kill a project regardless of how good the site otherwise looks.

This step is a quick map read that sets the geographic boundaries for the steps that follow. There's little point running a full parcel screen in a market that's already near its program cap.
Step 2: Find Target Parcels That Match Your Criteria
Once a target utility territory or county is selected, use LandGate’s Parcel Search Tool to filter millions of nationwide properties based on technical development criteria.
Filter by Contiguous Acreage: Set parcel size thresholds matching your capacity targets (e.g., 20-40+ acres for 5 MW community solar projects).
Constrain Grid Proximity: Apply distance filters to automatically isolate parcels within a set radius (e.g., within 0.5 miles) of distribution or subtransmission lines.
Filter by Distribution Level: Toggle between segment and feeders plus distribution line voltage and hosting capacity (MW).
Save Results to the Parcel Data Tool: Organically group qualified candidate parcels into custom Portfolios stored within LandGate's Parcel Data tool to keep team pipeline management organized.

The segment-versus-feeder toggle matters more than it might seem. Feeder-level hosting capacity gives you the bigger-picture read on a distribution circuit; segment-level data narrows that down to the specific stretch of line closest to your parcel, which is usually the more decisive number for a project this size. Running both searches is worth the extra few minutes - a feeder can show healthy capacity overall while the segment nearest your parcel is already constrained.
The output of this step should be a working list of candidate parcels, not a final short list. You're filtering out the parcels with no plausible path to interconnection, not yet picking a winner.
Step 3: Screen Individual Parcels
With a manageable list of grid-viable parcels, shift from "can this connect to the grid" to "can this parcel physically host a project." This is where a site that looks perfect on the grid side can still fail for reasons that have nothing to do with electrical capacity.
Slope and Terrain: Affects both construction cost and racking design
Acreage: Checked against the MW capacity you're targeting for the project
Land Use and Current Zoning: To catch conflicts before they become a rezoning fight
Existing Leases and Easements: Use LandGate's Leases layer (provided via Topos) to map lease and easement activity across renewables, utility, data center, oil & gas, conservation easement, residential solar, and other miscellaneous categories. A parcel already encumbered by a conflicting lease or a conservation easement is one you want to know about before you approach the landowner, not after.

This step is where a lot of developers still rely on manual courthouse or GIS-portal research, parcel by parcel. Running it against a consolidated set of layers turns what's often a multi-day task into an afternoon. If you find unfit parcels within the portfolio from this step, you can remove them by clicking on the parcel on the map.
Step 4: Evaluate the Power Grid
Grid constraints and queue congestion are the leading causes of late-stage project failure. LandGate centralizes nationwide power infrastructure data (including over 84,000 mapped substations), so you can evaluate circuit viability down to the feeder level.
Verify Infrastructure & Voltage: Inspect adjacent lines to confirm 3-phase distribution or subtransmission voltages suitable for community solar interconnections (typically 4 kV to 34.5 kV).
Inspect Hardware Capacity: Review feeder MVA ratings and subtransformer rated MVA directly on the platform to confirm the system can accept new generation.
Check Hosting Capacity & Headroom: Analyze utility hosting capacity layers to verify available thermal and voltage headroom for 1–5 MW project sizes.
Analyze Interconnected & Queued DERs: Inspect surrounding operational solar assets and active queue positions on the circuit. View parent operators, queue status (IA Pending vs. Approved), and total MW load ahead of you to evaluate curtailment risk and avoid paying for another developer’s grid upgrades.

This is the layer of detail that separates a real pre-screen from a superficial one. A parcel can clear every filter in Step 2 and still carry a real risk of triggering a network upgrade once you look at transformer headroom and queued DER on the specific circuit. Catching that before an interconnection request is filed is the goal of this step.
Step 5: Model the Community Solar Project Economics
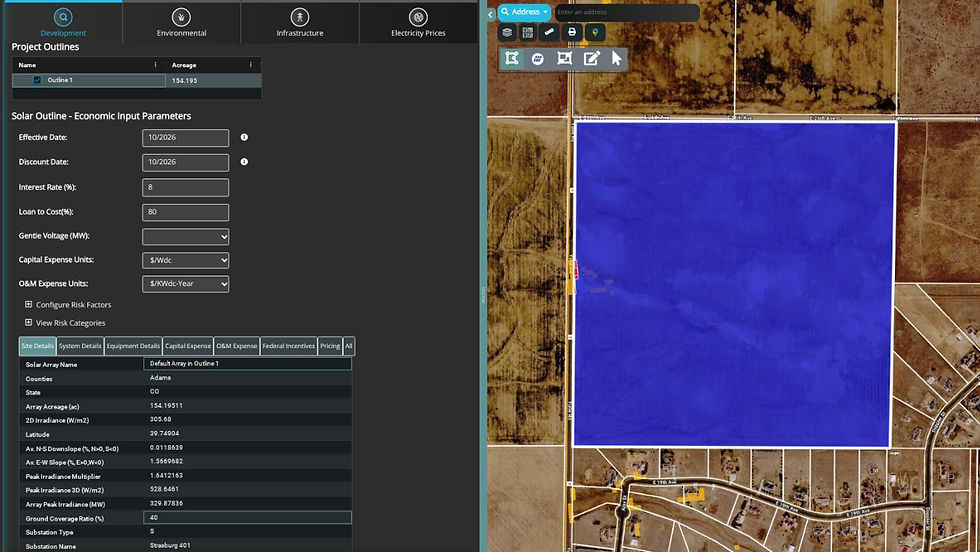
By this point, you should have a short list of parcels that are viable on the grid, clean on-site, and compliant with local zoning and ordinances. The last step before committing real capital - legal review, interconnection application fees, land option payments - is running the numbers. In LandGate, is a straightforward workflow: parcels identified in Parcel Search are saved into a portfolio in the Parcel Data tool, and from that portfolio, you can create a Solar Analysis project to run the economics.
Run Automated Solar Economics: Instantly model project financial profiles, including levelized cost of energy (LCOE), levelized margins, cap-ex/op-ex estimates, and estimated land lease/purchase costs.
Generate Financial & 8760 Profiles: Export comprehensive pro-forma financial reports, net asset valuations (NAV), and 8760 hourly generation profiles to present to internal investment committees.
From here, this is the go/no-go gate. A parcel that makes it here with strong economics moves forward to formal interconnection requests, legal diligence, and landowner outreach. One that doesn't pencil out gets killed here before any additional spend rather than after a study comes back with an upgrade cost that erases the project's returns.
Why This Order Matters
Each step in this process is cheaper to run than the one after it, and each one exists to protect the time and money spent on the steps that follow. Market analysis is a map read. Parcel search is a filtered query. Site and grid screening take a bit more digging but are still desk work. Economic modeling takes real analysis time. A formal interconnection request takes months and real fees. Running the funnel in this order means the community solar parcels that reach the expensive, slow stages are the ones that have already survived every cheap, fast filter that could have killed them for free.
Screen and Model Your Next Community Solar Site in LandGate
LandGate brings every layer in this workflow into a single platform. Instead of stitching together utility hosting capacity maps, county GIS portals, and separate lease research, developers can run the full process from market scan to kill/advance decision without leaving the vertical intelligence software.


